

Business Observability: The Layer Most Enterprises Are Missing

Most technology problems announce themselves. A server crashes. An alert fires. Someone gets paged. But the most expensive problems, the ones that cost enterprises millions in penalties, lost clients, and missed regulatory windows tend to arrive silently. Everything looks fine. The dashboards are green. And somewhere downstream, a critical business process has quietly stopped working.
Analysts estimate enterprises lose roughly 400 billion USD a year to unexpected IT failures, with typical outages costing more than $300,000, according to ITIC’s 2024 Hourly Cost of Downtime survey.
This is the problem that nobody in enterprise IT has been adequately equipped to solve. Not because the tools are bad. But because for decades, we've been building tools that watch the technology and calling that good enough. It isn't. And the industry is only now beginning to reckon with why.
Before the Dashboards: The Era of Gut Feel and Blinking Lights
To understand where we are, it helps to know where we started.
In the early mainframe era, there were no dashboards, no alerts, no automated monitoring in any meaningful sense. Monitoring meant a trained technician physically watching the output lights on a control panel. The machine literally told you something was wrong by lighting up. There were core dumps when systems crashed and log files if you were lucky, but the idea of software proactively watching itself and raising an alert was decades away.
These systems were also fundamentally batch-oriented. You submitted a job, you waited, you got output. There wasn't much "real-time" to monitor. And because the machines lived in locked, climate-controlled rooms tended by specialists, the gap between "technology working" and "business working" was narrow. If the mainframe was up and your batch jobs completed, the business was running.
That simplicity started unravelling in the 1980s with the rise of client-server computing. Suddenly, IT wasn't a single machine in a room. This consisted of PCs, servers, and databases distributed through offices, across countries, all communicating with each other. Troubleshooting meant looking not only at lights, but identifying which among the many connected devices was causing the trouble.
The first monitoring applications made their debut: these allowed users to ping servers, check whether they were functioning, and notify someone if a server went offline. Nagios, released in 1999, became the defining open-source tool of this era. The philosophy was simple: watch the infrastructure, alert on failure. Keep the machines up. That was the job.
And for a while, it was enough.
Generation 2: The Rise of Application Performance Monitoring
In the late 1990s, a new challenge had emerged. The network was up, but the applications were slow. Transactions failed for no apparent reason, and it was hard to find out why, since all the servers appeared healthy.
That's where application performance management, or APM, made its appearance.
Commercial APM tools hit the market in the late 1990s. Rather than simply pinging a server and getting a response, an APM tool traced the path of a specific transaction as it moved through the system.
It would be a decade before APM came into its own. By 2008, APM tools had become more advanced, and what enterprises got was nothing less than revolutionary. With APM, it became possible to:
- Trace a single transaction end-to-end across every service and database it touched
- See code-level diagnostics — which exact line of code, which SQL query, which external API call was introducing latency
- Get automatic baselining — the tool learns what "normal" looks like and alerts you when behaviour deviates
- Understand dependencies between services, so when one thing slows down, you can see what else it pulls down with it
For engineering and operations teams, this was a revelation. No more guessing. No more reading stack traces in the dark. When your checkout flow slowed down on Black Friday, APM could tell you in minutes which database query was the culprit and exactly how long it had been degrading.
APM got very, very good at answering one question: "Is my application performing correctly technically?"
The problem is that this is almost never the question the business is actually asking.
The VP of Operations doesn't ask "what's my 95th percentile API response time?" She asks "are our end-of-day settlements going to clear on time?" The compliance officer doesn't ask "what's the error rate on the message queue?" He asks "did we breach the regulatory cut-off window again?"
APM doesn't speak that language. It was never designed to. It speaks in milliseconds and error rates and throughput metrics. Useful. Essential, even. But not the full picture.
Generation 3: Full Stack Observability — The Promise and the Gap
In the 2010s, the architecture of enterprise IT changed again and this time, it changed dramatically.
Monolithic applications gave way to microservices. On-premise infrastructure moved to the cloud, or hybrid cloud, or multi-cloud. A single customer transaction that once touched three or four systems now touches dozens, each owned by a different team, each deployed on different infrastructure, each emitting its own stream of logs and metrics.
The term "observability" itself moved into mainstream IT vocabulary around 2017, largely driven by the DevOps and SRE communities. The word has older roots: it was coined by Hungarian-American mathematician Rudolf Kalman in 1960, describing a control theory concept: a system is "observable" if its internal state can be inferred from its external outputs. The DevOps world borrowed and applied it to software: can you understand what's happening inside your system from the signals it produces?
In 2020, Gartner defined observability as "the evolution of monitoring into a process that offers insight into digital business applications, speeds innovation and enhances customer experience." Critically, notice what Gartner said: digital business applications. Not just infrastructure. Not just code. Business applications. The intent was always that observability would ultimately connect technology performance to business outcomes.
The tools that emerged, log analytics platforms, FSO suites that could ingest everything from everywhere were genuinely powerful. The value proposition was compelling: correlate every log, every metric, every trace across your entire estate. Build dashboards for anyone in the organisation. Make the whole enterprise observable.
The result? Enterprises found themselves with more data than they had ever had. And paradoxically, more confusion than ever about what was actually wrong when something broke.
More data did not mean more understanding. And it certainly did not mean business understanding.
Generation 4: Completing the Full Stack — The Business Observability Layer
Business observability is the layer of full stack observability that was always supposed to be at the top of it and the one that most enterprises have never actually built.
Completing that top layer means fundamentally changing what you ask your observability stack to do. The technical layers answer: "What is happening in my systems?" The business layer answers: "What does that mean for my business, right now?"
In practice, building the business observability layer requires three things that most FSO deployments have never attempted:
- Map business processes as actual flows — a visual, sequential chain of steps that together produce a business outcome. A payment clears. A report publishes. A claim settles. Each step mapped, each dependency understood.
- Attach business targets to each step — SLA windows, cut-off times, volume thresholds, regulatory controls defined in business terms. Not "API response time under 500ms" but "settlement batch must complete before 17:00."
- Connect those business targets to your underlying technical data — so that when a service degrades, the signal that surfaces isn't just a technical alert. It's a business-level warning: "this flow is trending amber and will breach its cut-off in 38 minutes." The developer sees the code problem. The ops manager sees the affected flow. The CXO sees which business units are at risk. One dataset. Different levels of context for different roles.
Your infrastructure monitoring, your APM, your log analytics stay exactly as they are. The business layer is built on top of them, giving everything below it the business context it was always supposed to have.
That's Exactly What HCL iControl Does
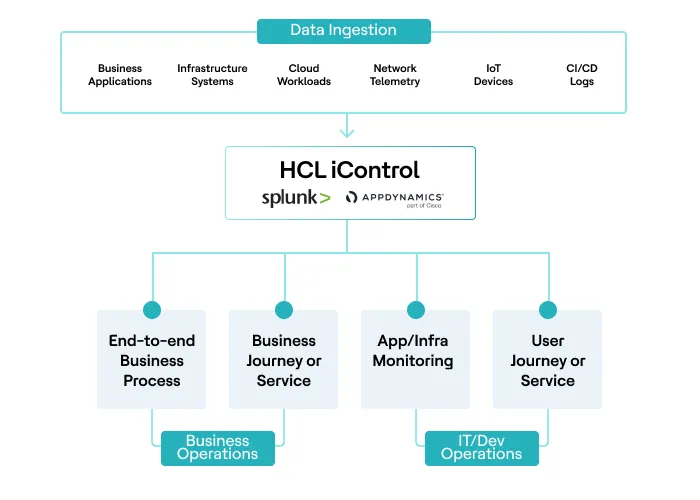
Here is the practical reality for most large enterprises: they have already invested significantly in monitoring platforms. APM tools like AppDynamics watching applications at the code level. Log analytics and data platforms like Splunk ingesting and correlating events across the estate. Infrastructure monitoring covering servers, networks, and cloud resources.
Together, these give you a strong technical foundation for Full Stack Observability. HCL iControl sits above them as the business layer, consuming the telemetry they produce and translating it into business-process intelligence. Think of it as three distinct layers working together:
- APM tool detects performance degradation at the application and code level — slow queries, failing services, latency spikes
- Data platform ingests that signal alongside everything else across your estate and correlates it
- HCL iControl takes all of that and answers the question none of those tools can: what does this mean for the business process, right now, and is it going to breach its target?
What HCL iControl adds specifically:
Process-first observability: Rather than starting from a technical alert and working backwards to find business impact, HCL iControl starts from the business process. You define the flow, every step, every dependency, every SLA target and HCL iControl monitors it end-to-end in real time. When something degrades upstream, you see downstream business impact before it becomes a breach.
AI-led predictive intelligence. HCL iControl uses Splunk's Machine Learning Toolkit to power KPI failure predictions. It tells you something is about to go wrong, based on patterns in your historical data. Queue counts trending the wrong way. Processing rates falling behind schedule. Cut-off windows approaching with volumes still unprocessed. You see it 30, 40, 50 minutes before it becomes a problem.
A single pane of glass across business and IT. The developer sees the technical signal. The ops manager sees the affected business flow. The CXO sees organisational health at a glance. Everyone is looking at the same underlying data just at the level of detail that is relevant to their role.
Identification of what to fix next. Because HCL iControl maps every step of every business process against real performance data, it can surface not just current problems but the processes that repeatedly come close to breach, flows with recurring near-misses, areas where re-engineering or automation would eliminate the risk entirely.
The $45 Billion Problem: When 2 Billion Alerts Tell You Nothing
A Fortune 500 financial services firm with $45 billion in revenue, operations in 50+ countries had invested heavily in monitoring. APM tools, log analytics, infrastructure dashboards, the works. They were collecting every signal imaginable. And they were completely blind to what mattered.
The Daily Reality:
- 2 billion technical alerts flooding in
- Real problems invisible inside the noise
- Payment files missing regulatory cut-offs
- VIP client transactions stuck in limbo
- Operations teams firefighting problems they discovered hours too late
What Changed
They deployed HCL iControl on top of their existing monitoring stack. A single dashboard showing the entire payments process flow, end to end. Business outcomes.
- Payment inactivity warnings with cut-off proximity
- Queue counts trending the wrong way, flagged 40 minutes before breach
- Processing rates falling behind schedule surfaced while there was still time to act
- VIP client files getting special attention before they became escalations
The Results
- 90% reduction in KPI breaches. Payment processes that routinely missed cut-offs were now completing on time.
- 80% decrease in major incidents. Problems caught and resolved before they cascaded into outages.
- One full-time employee per week saved.
Read the full case study.
Across the broader HCL iControl customer base, the pattern holds: over 60% reduction in service level outages, up to 30 minutes saved per incident, up to 60 hours saved per month in manual checks eliminated.
The Bottom Line
We've spent 60 years building better and better tools to watch our technology. Infrastructure monitoring. APM. Full Stack Observability. Each generation solved a real problem and moved us closer to the original goal: a complete, continuous picture of whether the enterprise is working.
But most enterprises stopped one floor short.
The technical layers are solid. The business layer, the one that connects all that technical data to actual business processes.
If there's one thing worth taking away from this: start there. Not with more infrastructure tooling. Not with another APM evaluation. Start by asking whether your organisation can answer right now, in real time whether its critical business processes are on track. If the honest answer involves spreadsheets, morning stand-up calls, or waiting for a client to tell you something broke, you have the gap. Business observability closes it.
Your apps being healthy is a good start. Knowing your business is healthy is the point.
Interested in seeing how this works for your organisation? Register here for a consultation

Start a Conversation with Us
We’re here to help you find the right solutions and support you in achieving your business goals.


