

From IT Metrics to Business KPIs: A Guide to Business Monitoring

The CIO walks into the quarterly business review feeling confident. His presentation is polished, every slide tells a good story. Green lights everywhere with 99.97% uptime, mean time to resolution down 23%, zero critical security incidents. By any technical measure, IT had a stellar quarter.
Then the CFO asked for a harder question. "These numbers look impressive, but I'm curious, did any of this actually help us hit our Q3 revenue target?"
This scenario is common across digital enterprises. IT talks uptime and response times. Business talks revenue and customer retention. They're measuring performance in completely different units, and the translation just doesn't happen.
And this disconnect is expensive. According to ITIC’s 2024–2025 Hourly Cost of Downtime survey, over 90% of mid‑size and large enterprises say a single hour of unplanned downtime costs more than 300,000 USD. But here's the disconnect: when IT shows up at the review and says "99.9% uptime," business leaders have no way to translate that into actual dollars at risk or how many customers got hit.
Here's what most organizations miss: this isn't a reporting problem. It's a structural problem in how performance gets measured, how systems get instrumented, and how teams work together. Effective business monitoring solves this by connecting technical metrics to business outcomes.
Why the Gap Exists
Modern digital operations are complex. One customer clicks "buy now" and suddenly 35 different microservices fire off. Multiple cloud environments get involved. Half a dozen third-party integrations start processing. When something breaks in that chain? Figuring out the business impact means connecting dots across systems that were never designed to talk to each other.
IT focuses on system health. The questions they ask: Is the application responding? Are error rates within bounds? Is infrastructure performing as designed? These matter for keeping systems stable, but they exist at a technical level that's hard to translate into business impact.
Business cares about outcomes. Their questions sound different: Are customers completing purchases? Are we meeting our service commitments? Are we achieving strategic goals? These outcomes depend on IT performance, but the connection isn't automatic or visible.
The AWS Well-Architected Framework encourages teams to "start with business outcomes" before diving into metrics, and to “correlate technical metrics with business objectives,” noting that not all technical metrics impact outcomes. Organizations focusing solely on technical metrics without business correlation often miss vital signals that matter to leadership.
Consider what this looks like in practice: An application maintains 99.9% uptime for the month. From IT's perspective, that's strong performance. But if that 0.1% downtime happens during Black Friday weekend, the business impact is catastrophic compared to the same downtime during a slow Tuesday afternoon. Without connecting the technical metric (uptime percentage) to business context (when it happened and what was affected), the real story stays hidden.
Traditional monitoring systems are built for answering technical questions. Which service is slow? Where's the bottleneck? What's failing? IT needs these answers to keep operations running. The problem is these questions don't reveal which customers are affected, how much revenue is at risk, or which business processes are breaking.
Most organizations underestimate this effort and end up with partial instrumentation that doesn't enable the correlation they need. The technical metrics exist in one system, business outcome data exists in another system, and somebody has to manually connect them, usually during post-incident reviews when it's too late to take action.
The Framework: Five Steps That Actually Work
Here's how to build the bridge between IT metrics and business KPIs in a way that's sustainable, not just a one-time project that falls apart when people move on.
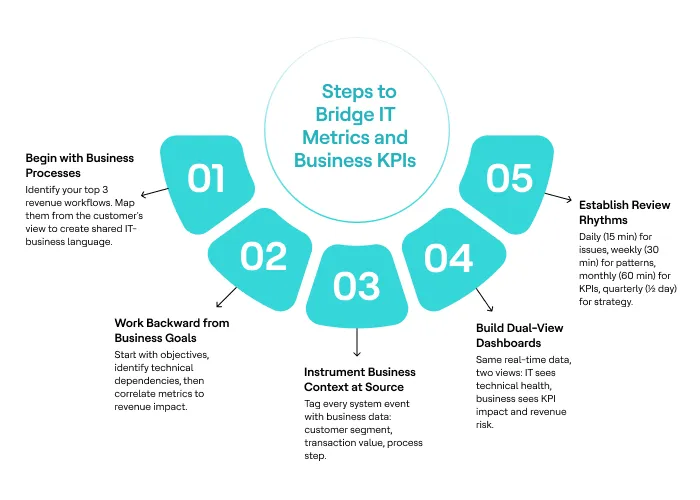
Step 1: Begin with Business Processes, Not with IT Systems
Stop thinking about services, applications, or infrastructure. Focus on business workflows, those real-world processes that generate revenues.
For banks? Loan origination, payment processing, account opening. Retailers have product searches, checkouts, order fulfillment. Healthcare organizations run on patient registration, appointment scheduling, claims processing.
Identify your top three most valuable business processes. Not ten, not five. Just three. Pick the ones that generate the most revenue, serve the most customers, or define what makes you different from competitors.
Then map your process from the customer's view. What are they trying to accomplish? What hoops do they jump through to get it done? What kind of technical system does this require? Where is value creation or destruction taking place in each step?
Now you've built a language. You should be able to show this diagram to any person in IT or business and they'll see how their job affects the business outcome. This becomes the foundation for business process monitoring.
Step 2: Work Backward from Business Goals
Don't think about those KPIs that you currently measure. They shouldn't even appear until we know what business processes they help optimize.
Let's assume your business goal is to increase the e-commerce conversion rate from 2.1% to 2.8%. Now work backwards and identify technical dependencies involved:
- Conversion happens during checkouts
- Checkout requires payment gateways, inventories, and an order database
- Gather historical data for the past six months
- Run correlation analysis
You'll find, for example, that whenever payment API latency is above 500 milliseconds, cart abandonment increases by 12% . You've just made the connection: Payment API latency → Cart abandonment → Conversion rate → Revenue.
This isn't speculation. In one case, the team assumed the payment gateway had the most impact on conversion. But after applying correlation analysis, it became clear that replication lag of the database (something that only DBAs measured) was the key factor. It caused discrepancies in inventory counts, which made products unavailable when customers tried to make purchases.
The technical issue was subtle. The business impact was significant. Without correlation analysis and proper business KPIs monitoring, they never would have connected the dots.
Step 3: Instrument Business Context at the Source
Here's where most organizations fail: they try to correlate systems after the fact rather than instrumenting business context from the beginning.
When your application logs an API call, it should capture:
Technical data: response time, status code, error details
Business data: order value, customer segment, transaction type, process step
When a database query executes, tag it with the business process it supports. When an error occurs, include which customer was affected and what business outcome failed.
This requires development work. You can't just configure your way to a business context. You have to change how applications emit telemetry. Budget 180 engineering hours per major business process. Yes, that's significant. But it's the foundation that makes everything else possible.
For instance, a telecommunications company can rebuild their instrumentation so that every network event includes customer account ID and service tier, every transaction includes business transaction type and revenue impact, and every error includes affected customer segment and SLA risk. With this instrumentation, when a network issue occurs, they immediately see which customers are affected, what service tiers they're on, how much monthly recurring revenue is at risk, and which SLAs are being violated. No manual correlation is needed.
This level of instrumentation enables business observability, the ability to see business impact in real time.
Step 4: Build Dual-View Dashboards
Create dashboards that show the same data through different lenses:
For IT Operations:
- Technical health indicators
- Infrastructure performance
- Error rates and patterns
- Drill-down diagnostics
For Business Operations:
- Business process health
- KPI trending
- Business impact of issues
- Revenue at risk
The critical requirement: both dashboards share the same underlying data and update in real time. When IT sees a technical issue, business sees its impact simultaneously. When business sees a KPI deviation, IT sees the technical cause.
By implementing a "Customer Experience Dashboard," the telecommunications provider can grant leadership real-time visibility into subscriber health, call quality, and service availability. This unified view ensures that when performance dips such as call quality falling below a target threshold, business stakeholders immediately see the regional impact while engineers pinpoint the technical cause. This shared data foundation transforms raw metrics into actionable insights, driving instant alignment across the organization.
Step 5: Establish Review Rhythms
Technology enables alignment. Process sustains it.
Daily (15 minutes): IT and business operations review issues impacting processes today. What's broken? What's degraded? What needs attention before it gets worse?
Weekly (30 minutes): Look at trending patterns and near-term risks. What issues keep recurring? Are we seeing early signs of capacity problems? Which technical improvements would have the biggest business impact?
Monthly (60 minutes): Examine KPI performance, understand IT's contribution to business outcomes, and align on investment priorities. Are we measuring the right things? What changed this month?
Quarterly (half day): Step back and ask fundamental questions. Are the correlations we relied on still valid? What's changing in the business that requires new instrumentation? What new capabilities do we need?
The Manual vs. Platform Decision
You can build this manually with open-source tools, custom instrumentation, and data integration scripts. Many organizations do. But understand the maintenance burden.
Manual approaches require ongoing work to keep mappings current, update correlations as business processes change, and maintain data pipelines as systems evolve. For some organizations (those with strong data engineering capability, stable business processes, and five or fewer critical workflows) manual approaches work fine. For others (those with complex, frequently changing business processes, multiple business units, or limited data engineering resources) a platform approach makes sense.
This is where platforms like HCL iControl provide value. Rather than replacing your existing monitoring tools, iControl integrates with what you already have and adds a business process layer on top. You define your critical business processes as flows that map to underlying technical systems, and the platform maintains those mappings as things change.
When an issue occurs, both IT and business see it in terms they understand. IT sees which technical component is failing and what dependencies are affected. Business sees how many transactions are delayed, how much revenue is at risk, which customers are experiencing problems, and whether SLAs are being violated.
What Changes When You Get This Right
When IT metrics connect to business KPIs systematically, several things improve measurably.
Prioritization becomes clearer. When business impact is understood up front and baked into incident prioritization, fewer issues need last-minute emergency escalation, because teams focus immediately on what matters most to the business and route resources accordingly.
Decision-making accelerates. Organizations with real-time visibility into business impact can make critical decisions much faster during incidents because they no longer waste time manually stitching together technical symptoms and business data. In high-value digital businesses, every minute of delay during a major incident can represent thousands of dollars in lost revenue or productivity.
Investment evaluation improves. Organizations that make technology investment decisions with clear visibility into business impact consistently achieve stronger ROI than those that rely on purely technical arguments.
Operations become proactive. Organizations can detect and respond to issues before they impact customers by monitoring business metrics that serve as leading indicators of technical problems.
The cumulative effect: technology becomes clearly a driver of business value rather than just a cost center. IT leaders spend less time defending budgets and more time partnering with business leaders on strategy.
The Bottom Line
Connecting IT metrics to business KPIs through business monitoring is about transforming the way you measure success, monitor progress, and manage teams.
Start simple. Identify your organization's three most important business processes. Trace their full journey. Reverse engineer technical requirements based on business objectives. Perform correlation testing to determine the true drivers of business performance. Measure context at the source. Design bi-directional dashboards. Set up recurring reviews.
This should be done for one process first. Demonstrate the benefits. And then expand.
In a world where speed, dependability, and superior user experience create a competitive advantage, this alignment becomes a necessity rather than a luxury.
The connection between IT metrics and business KPIs is there to be made. It's just a matter of whether you'll construct it intentionally and systematically, or continue hoping the gap will somehow close on its own.

Start a Conversation with Us
We’re here to help you find the right solutions and support you in achieving your business goals.


